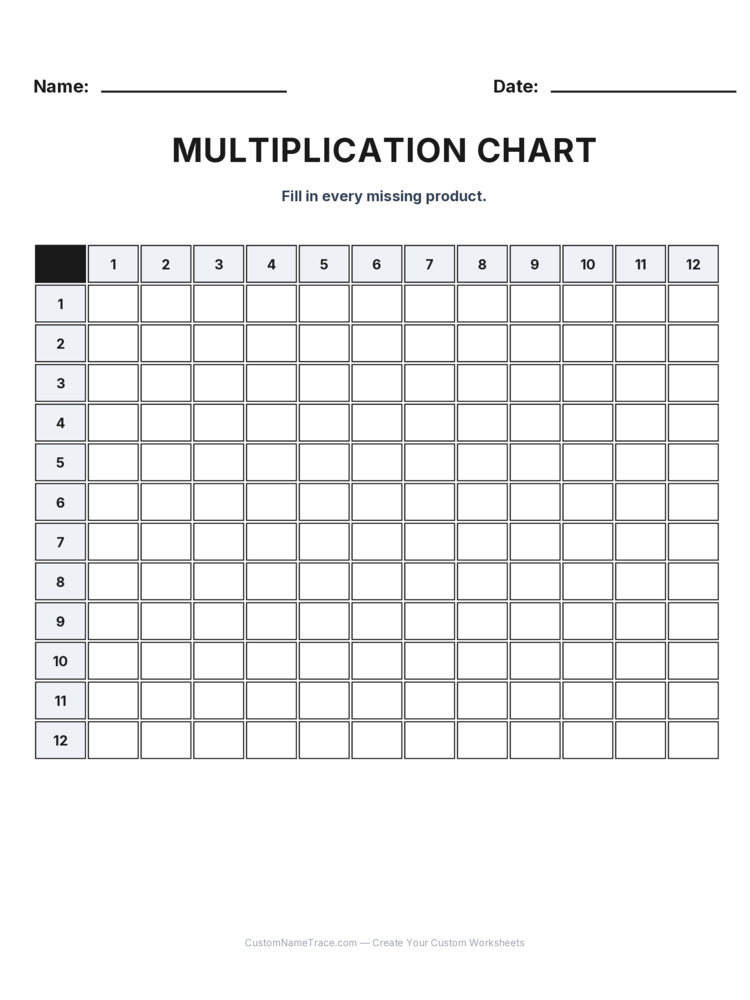
Why filling in a chart is different from using one
A pre-filled multiplication chart is a reference tool; this worksheet asks a child to build one from scratch, filling in every missing product in a 12-by-12 grid. That distinction matters — using a finished chart to look up an answer tests nothing beyond reading a table, while filling one in tests genuine recall (or a reliable fallback strategy) for every single fact in the full range, cell by cell, with nowhere to hide a gap in fluency.
Because the grid is genuinely large — 144 cells in total — this worksheet also doubles as a real test of sustained attention: staying accurate through the less familiar facts in the middle and later rows takes real focus, not just a burst of quick recall on the easy early ones.
Working through the grid efficiently
Filling in the easiest rows and columns first — the 1s, 2s, 5s, and 10s — builds momentum and confidence before tackling the genuinely harder facts (6 through 9 combined with each other) that make up the bulk of the remaining blank cells. Because the chart is symmetric — 7×8 and 8×7 land in mirrored positions and share the identical answer — filling in one side of the diagonal effectively completes the other half for free, which is worth pointing out explicitly rather than having a child recalculate every cell independently.
Working row by row rather than jumping around the grid also keeps a child from losing track of which cells are already complete, especially important given how large this specific worksheet is compared to most others on this site.
What a pattern of wrong answers usually reveals
Wrong answers clustered around specific rows or columns (say, every cell involving 7) point to a specific, addressable fact-family gap, distinct from wrong answers scattered randomly across the whole grid, which more often reflect rushing or a lapse in sustained attention rather than a true fact gap. Reviewing which specific rows have the most errors, rather than treating the whole chart as uniformly weak, targets follow-up practice far more efficiently.
This worksheet pairs naturally with this site's Multiplication Facts (0-12) practice — a completed, self-built chart works well as a personalized reference for continued fact practice afterward, since it reflects exactly the facts a specific child has (and hasn't) already reasoned through.
Why building the chart beats just handing one over
A pre-printed chart handed to a child skips the entire value of this exercise — the act of working out (or confidently recalling) every single cell is what builds and reveals genuine fluency, while simply reading a finished chart builds nothing beyond table-reading. Once this worksheet is completed correctly, keeping the finished result as a reference going forward is completely reasonable; the value was in the building, not in withholding the finished product afterward.
This is best used once a child already has real exposure to multiplication facts, not as a first introduction to the concept — building a chart from a position of near-total unfamiliarity turns a fluency check into a frustrating guessing exercise instead.
Using this worksheet effectively
Because this grid is large, splitting it across two shorter sessions rather than one long sitting keeps accuracy from degrading toward the end simply due to fatigue — there's no requirement to complete all 144 cells in one continuous effort. Checking work against known fact families (the 1s, 2s, 5s, 10s already solid) first can also confirm the easy rows are genuinely correct before assessing the harder ones.
Every worksheet here downloads as a free, print-ready PDF with no account required, sized to keep the full 12-by-12 grid legible on both Letter and A4 paper.